We’ve all experienced it. Settling down into bed for the night, only to be jolted awake an hour later to bass vibrating your bedroom walls, shouting, singing, and what sounds like a herd of elephants stomping about next door. Your neighbour’s random get-togethers can be okay as a one-off, but when they start to occur monthly, weekly or even daily – there comes a point where enough is enough.
If you learn anything from the numerous TV shows about nightmare neighbours, it should be that you aren’t alone. Thousands of noise complaints get filed in England every year. But which areas have the noisiest neighbours? The Sefton Meadows team decided to find out.
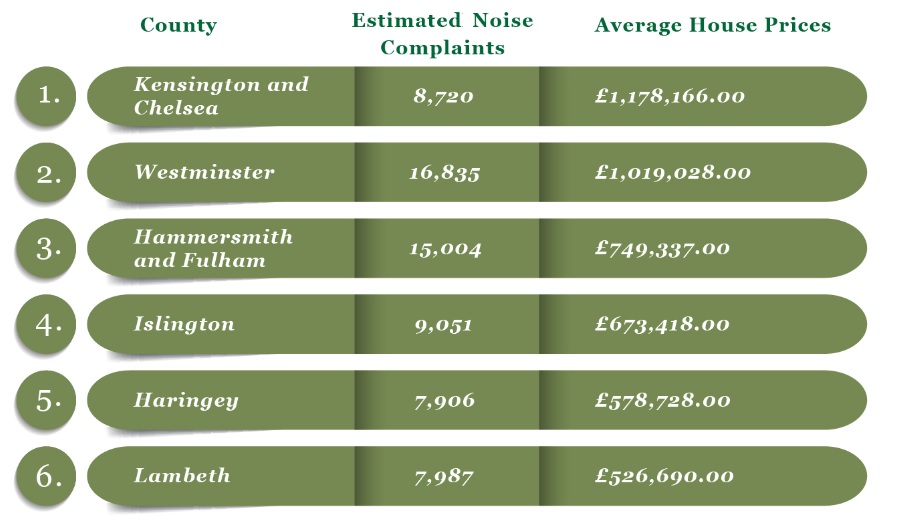
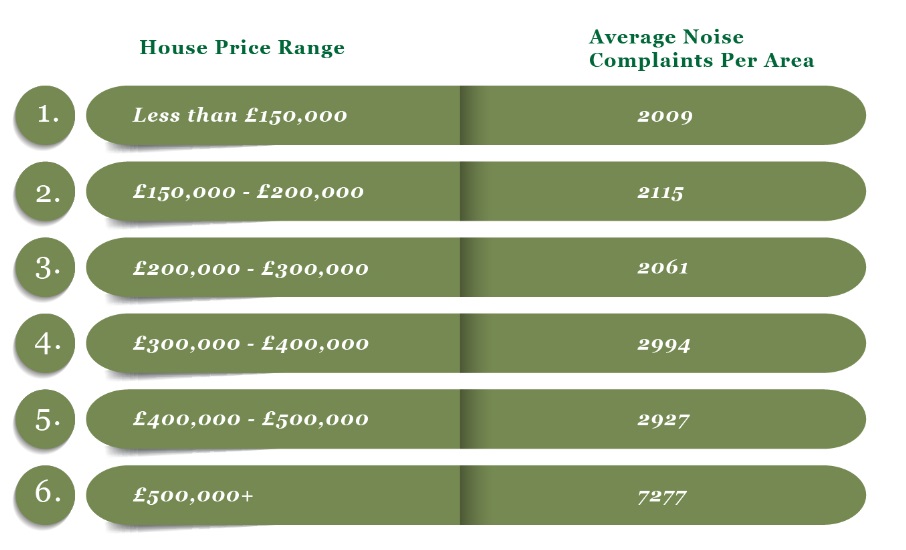
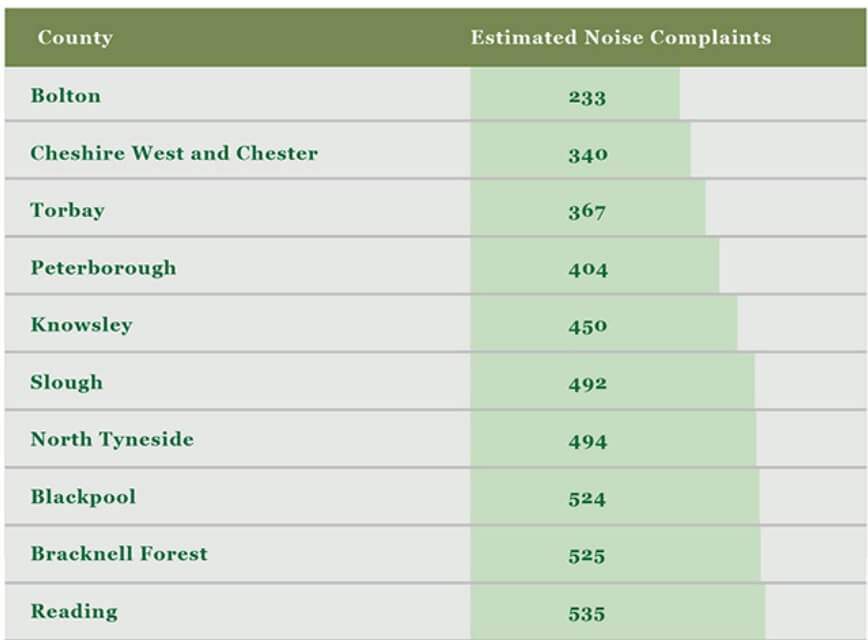
Interestingly, some of the areas which received the most noise complaints have the highest average house prices.
In fact, areas with an average house price above £500,000 saw a shocking number of noise complaints compared to regions that have lower house prices.
Regions with the most noise complaints
Each year, thousands of noise complaints are recorded across every region in England.
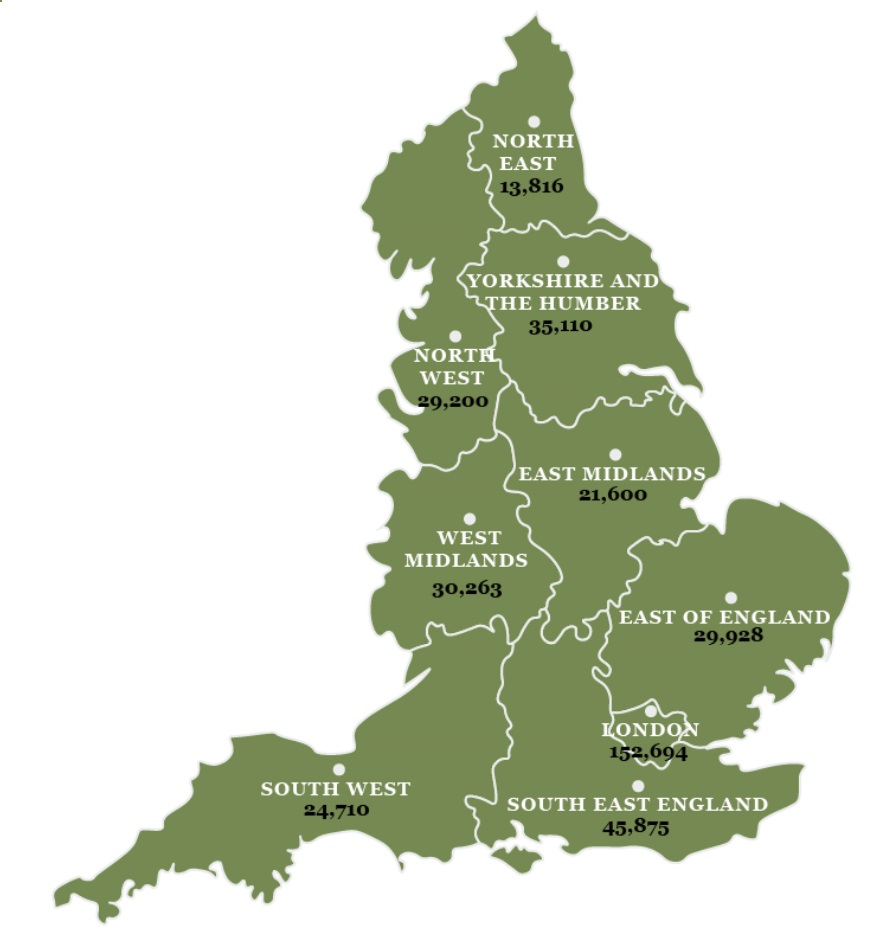
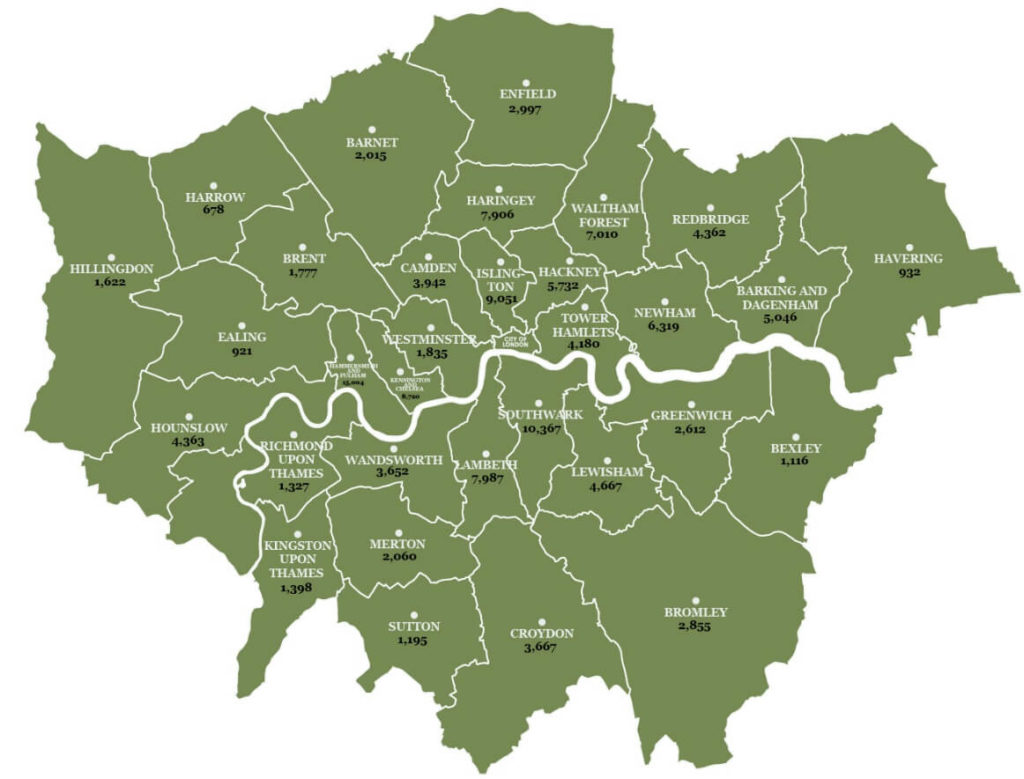
Perhaps unsurprisingly with a population of almost 9 million people, London comes in 1st place for the noisiest area in England – with the South East region coming 2nd.
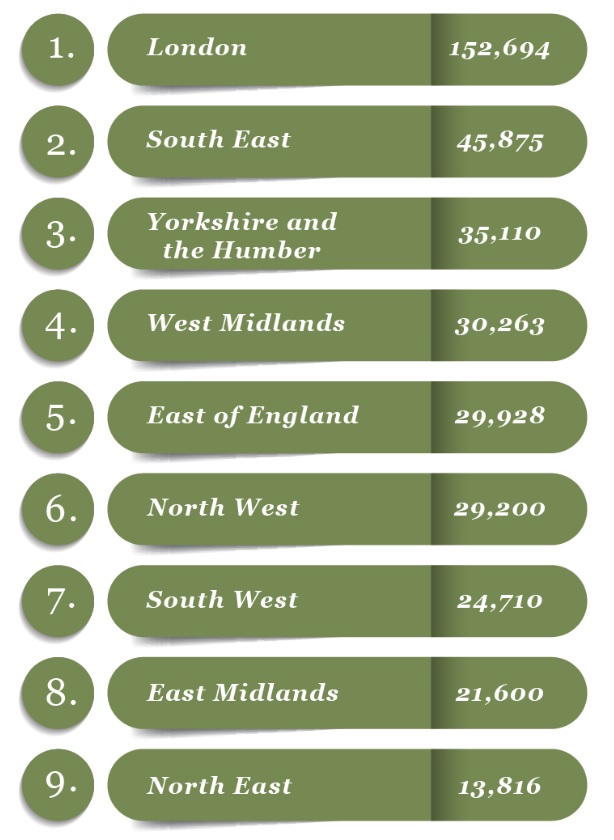
If you fancy a quieter life, the North East and East Midlands are the places to be.
These areas are the quietest
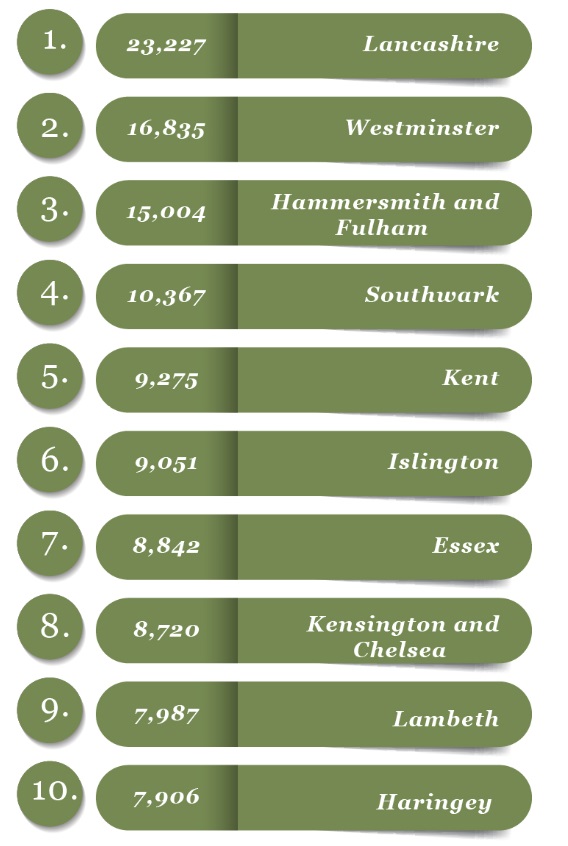
Who has the noisiest neighbours?
If you live in any of the following areas, congratulations, you officially have the noisiest neighbours in England. Unless you’re the noisy neighbour!
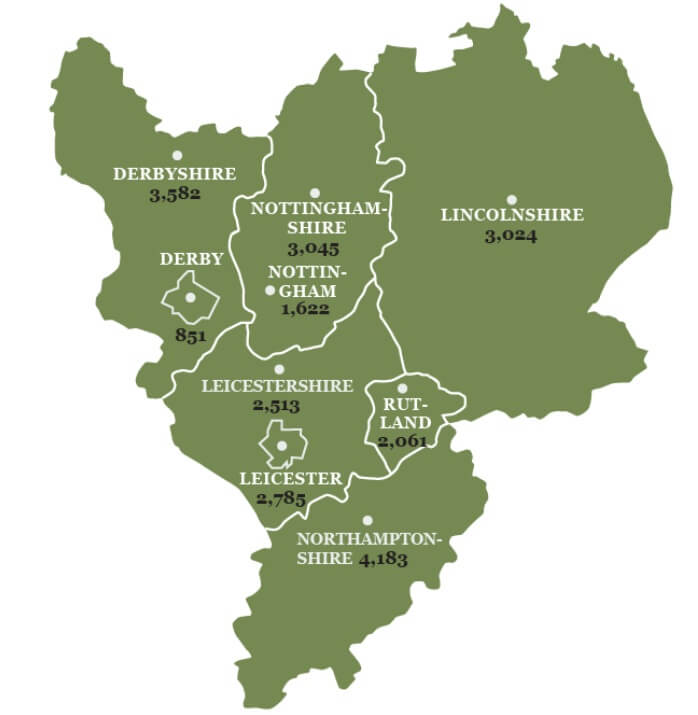
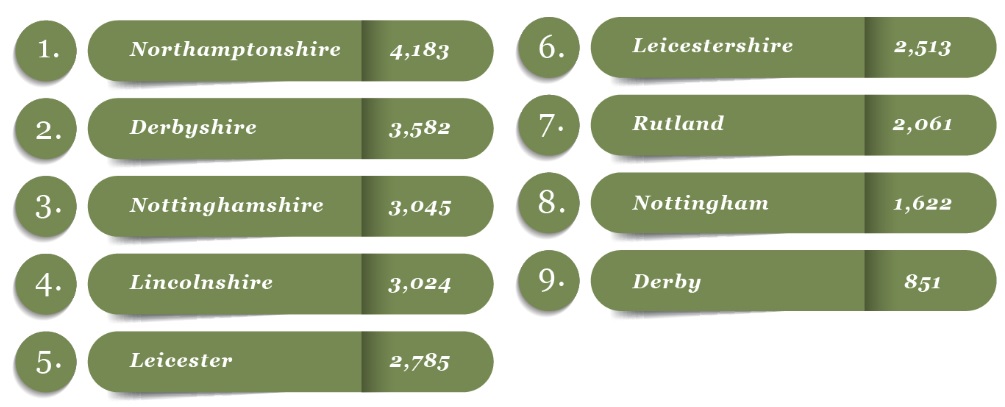
East Midlands
Complaints Per 1,000 of Population: 4.5 | Estimated Total Complaints: 21,600
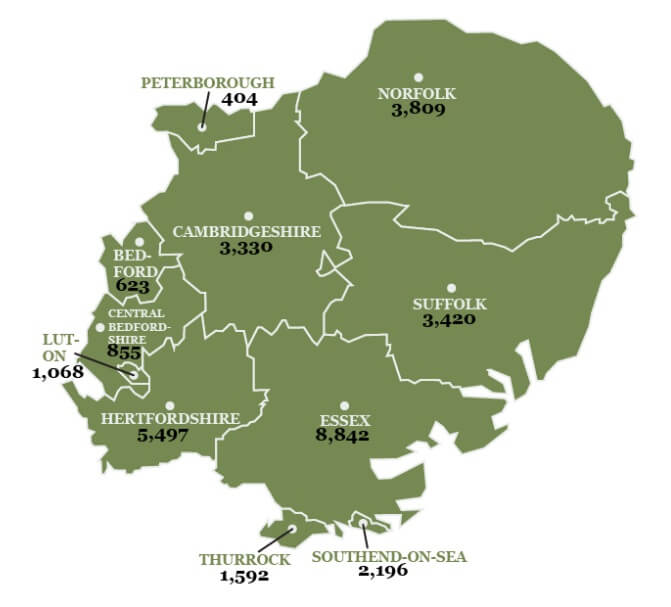
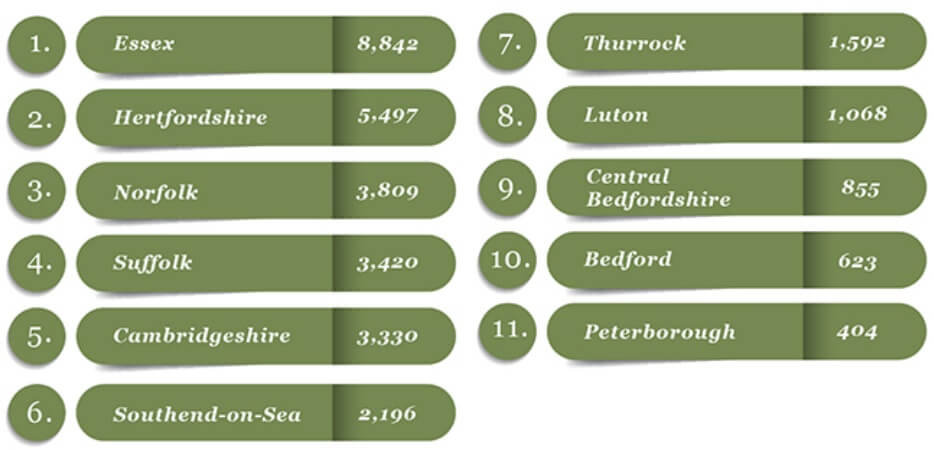
East of England
Complaints Per 1,000 of Population: 4.8 | Estimated Total Complaints: 29,928
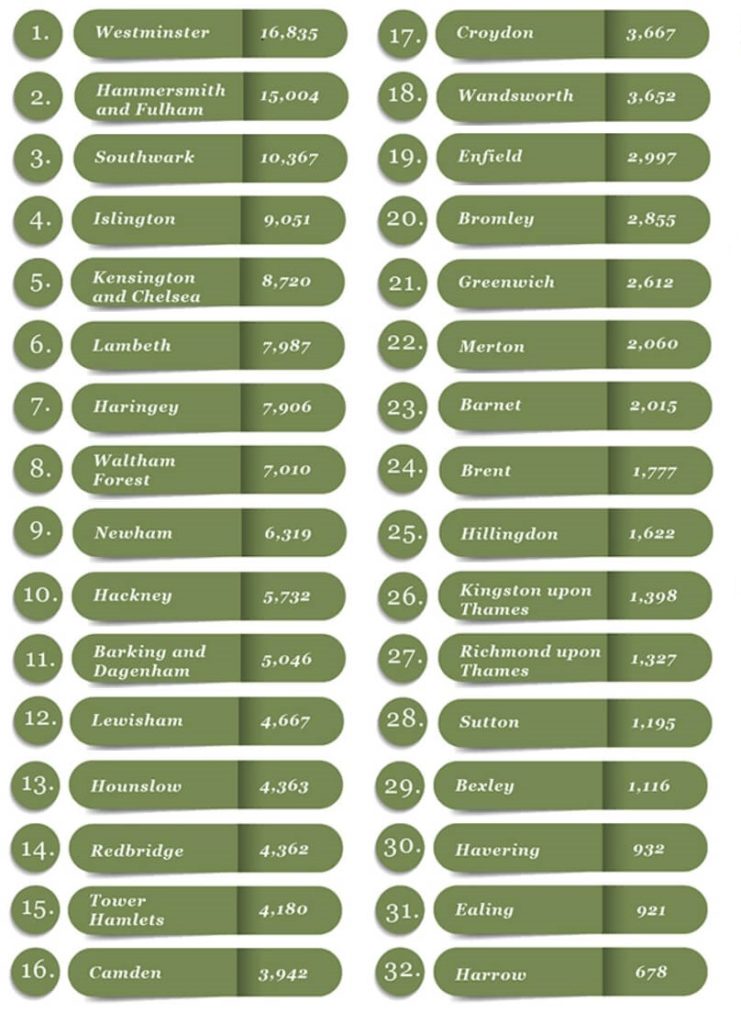
London
Complaints Per 1,000 of Population: 17 | Estimated Total Complaints: 152,694
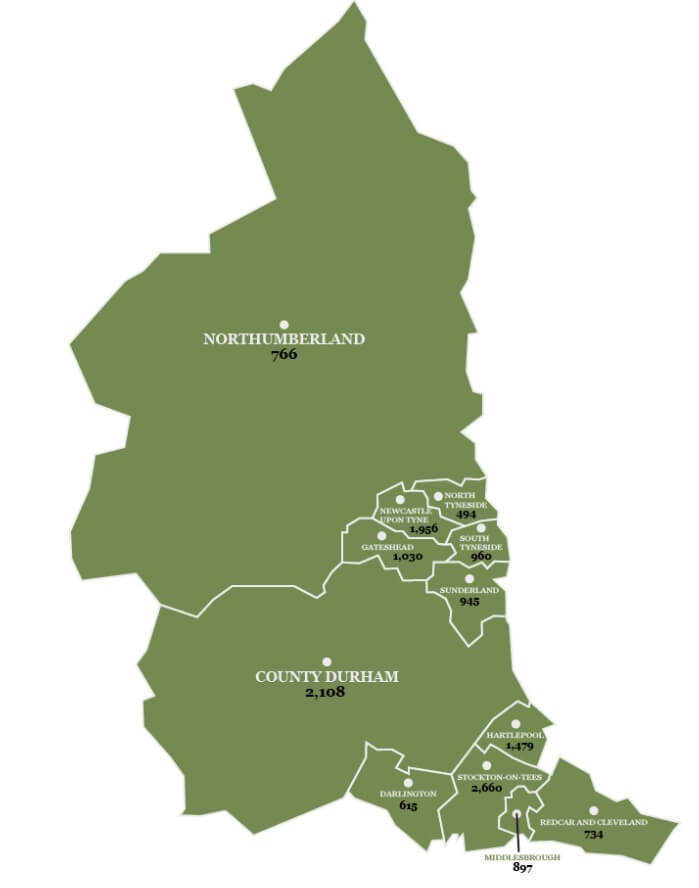
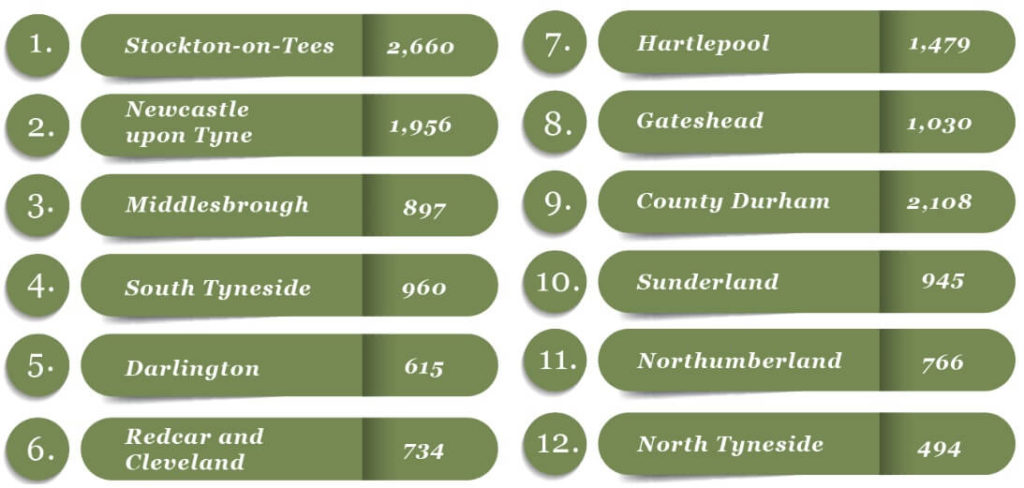
North East
Complaints Per 1,000 of Population: 5.2 | Estimated Total Complaints: 13,816
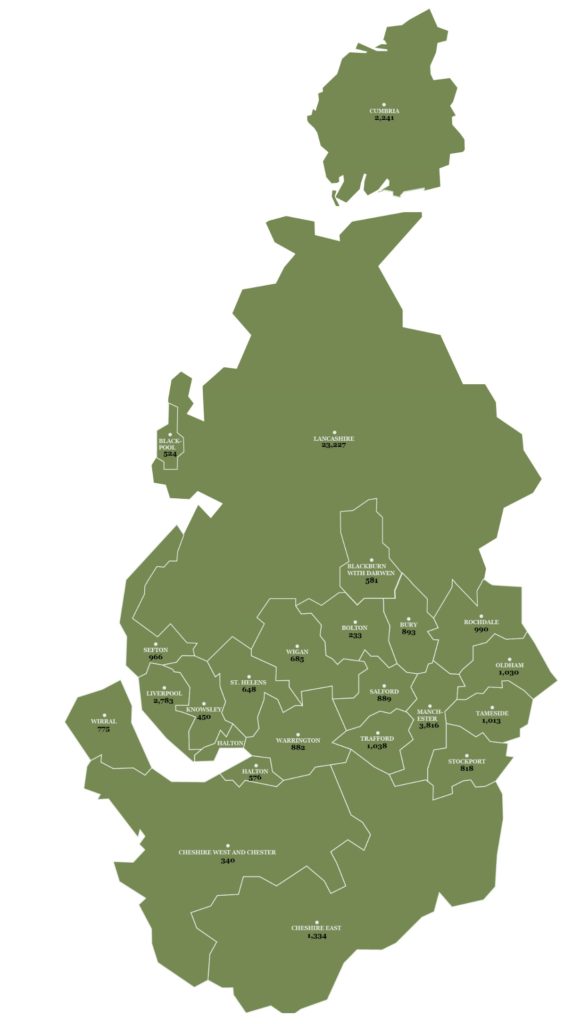
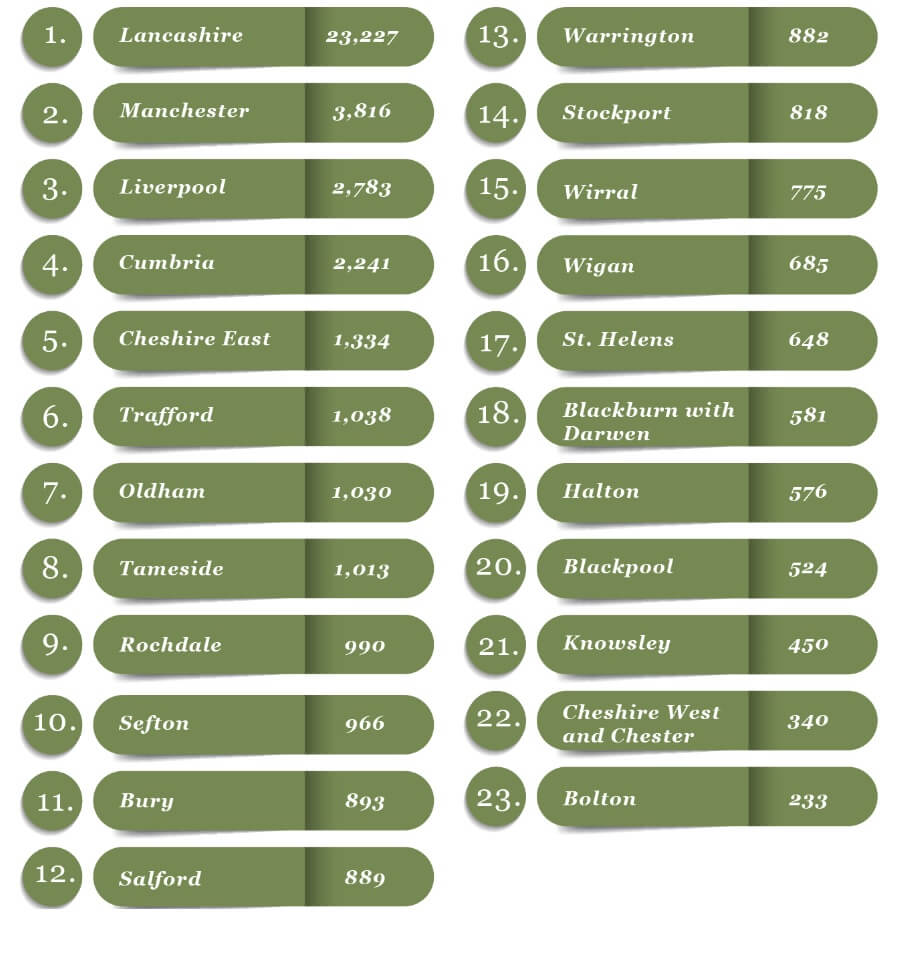
North West
Complaints Per 1,000 of Population: 4 | Estimated Total Complaints: 29,200
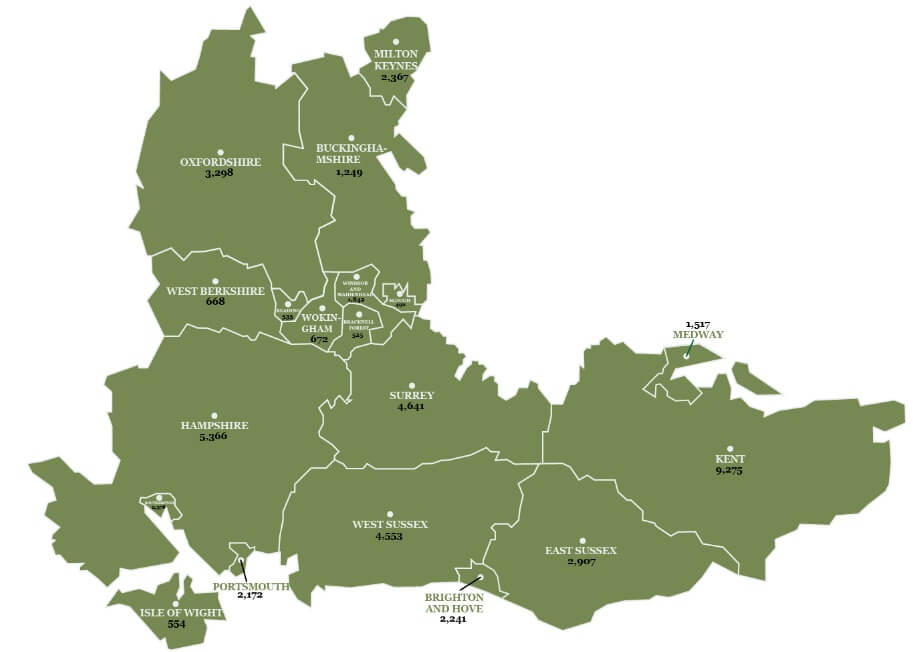
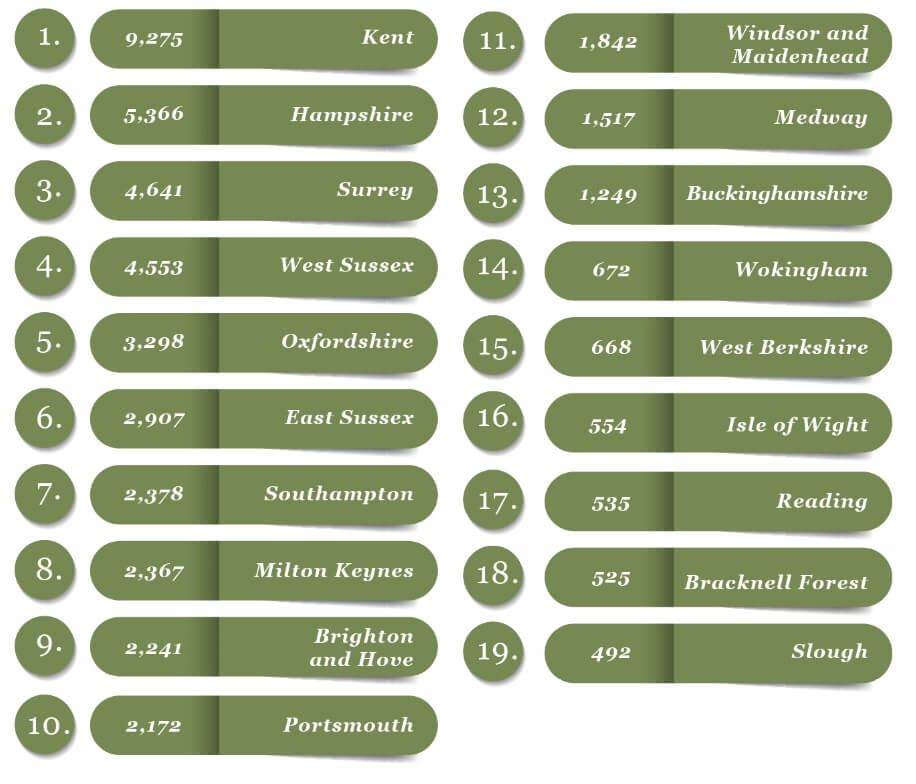
South East
Complaints Per 1,000 of Population: 5 | Estimated Total Complaints: 45,875
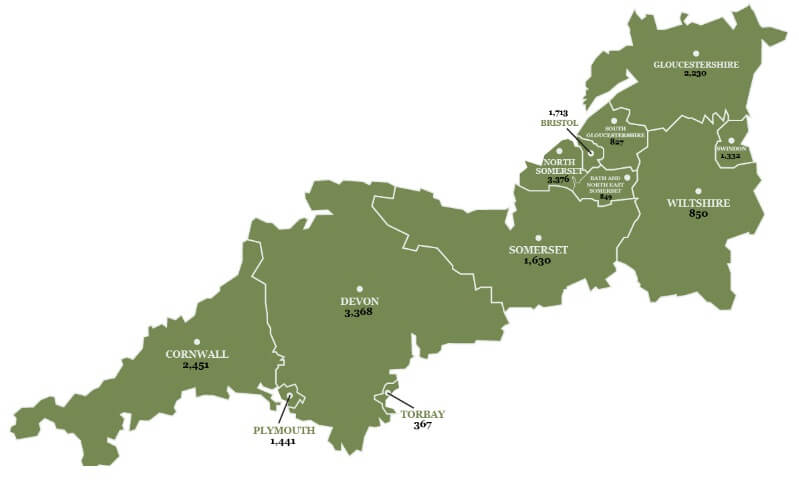
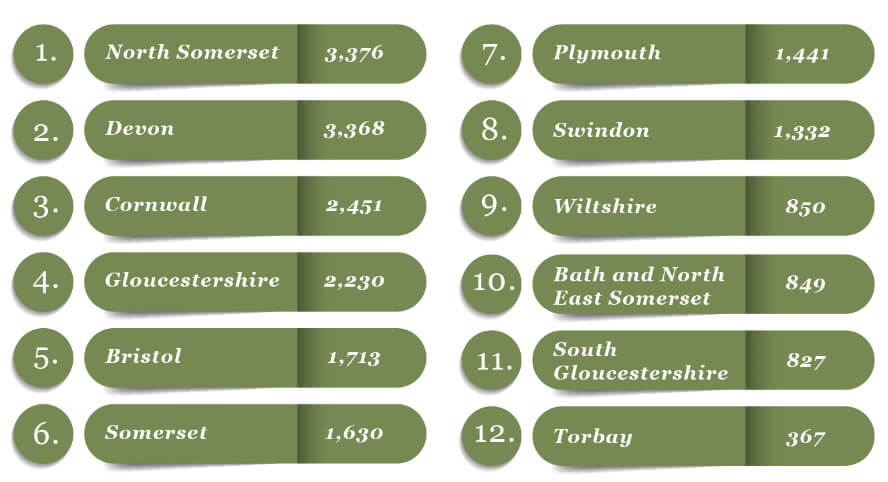
South West
Complaints Per 1,000 of Population: 4.4 | Estimated Total Complaints: 24,710
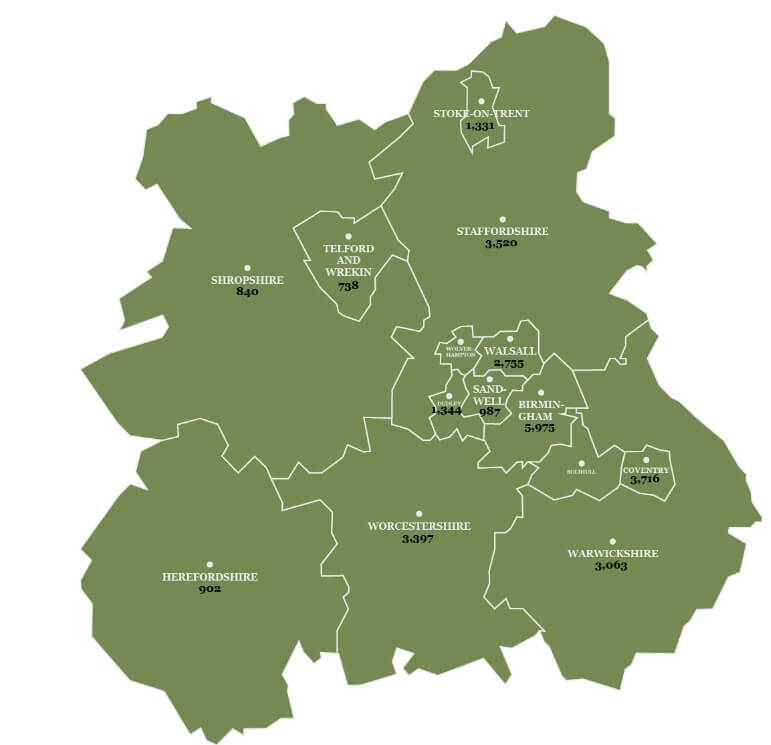
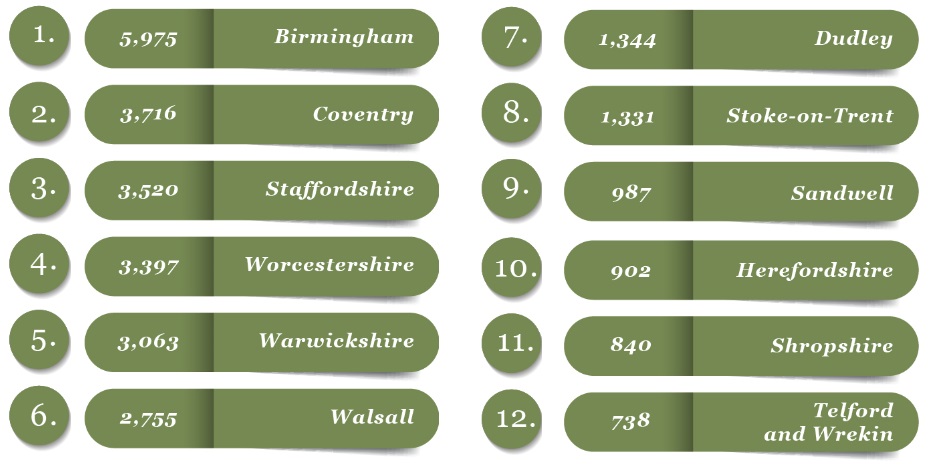
West Midlands
Complaints Per 1,000 of Population: 5.1 | Estimated Total Complaints: 30,263
Method
Noise complaint data sourced from Public Health England – Public Health Outcomes Framework for 2018/2019. Data was provided for every 1000 of the population in each region. In the regional charts, this was multiplied to match the estimated population of each region at the date of creation.
Formula used:
Population of region*/1000 x noise complaint per 1000 = estimated noise complaints
* Population of region rounded to nearest 1000
Sources
https://data.gov.uk/search?q=noise
https://wikishire.co.uk/wiki/Counties_of_the_United_Kingdom
https://fingertips.phe.org.uk/profile/public-health-outcomes-framework
Ryan Jenkins is a professional gardener and has been working in the gardening industry for over 25 years. This has allowed Ryan to accumulate a vast wealth of gardening knowledge which he shares on the Sefton Meadows blog.